

Statistics shows how readers use your help center: how many visit, what they search for, which articles they read and how they rate them. Use it to decide what to write or fix next.
Who can do this: Owners, Admins and Editors · Plans: All plans (how far back you can look depends on your plan)
Open Statistics
In the left menu, click Statistics. You can also go to https://helpcenter.io/app/statistics.
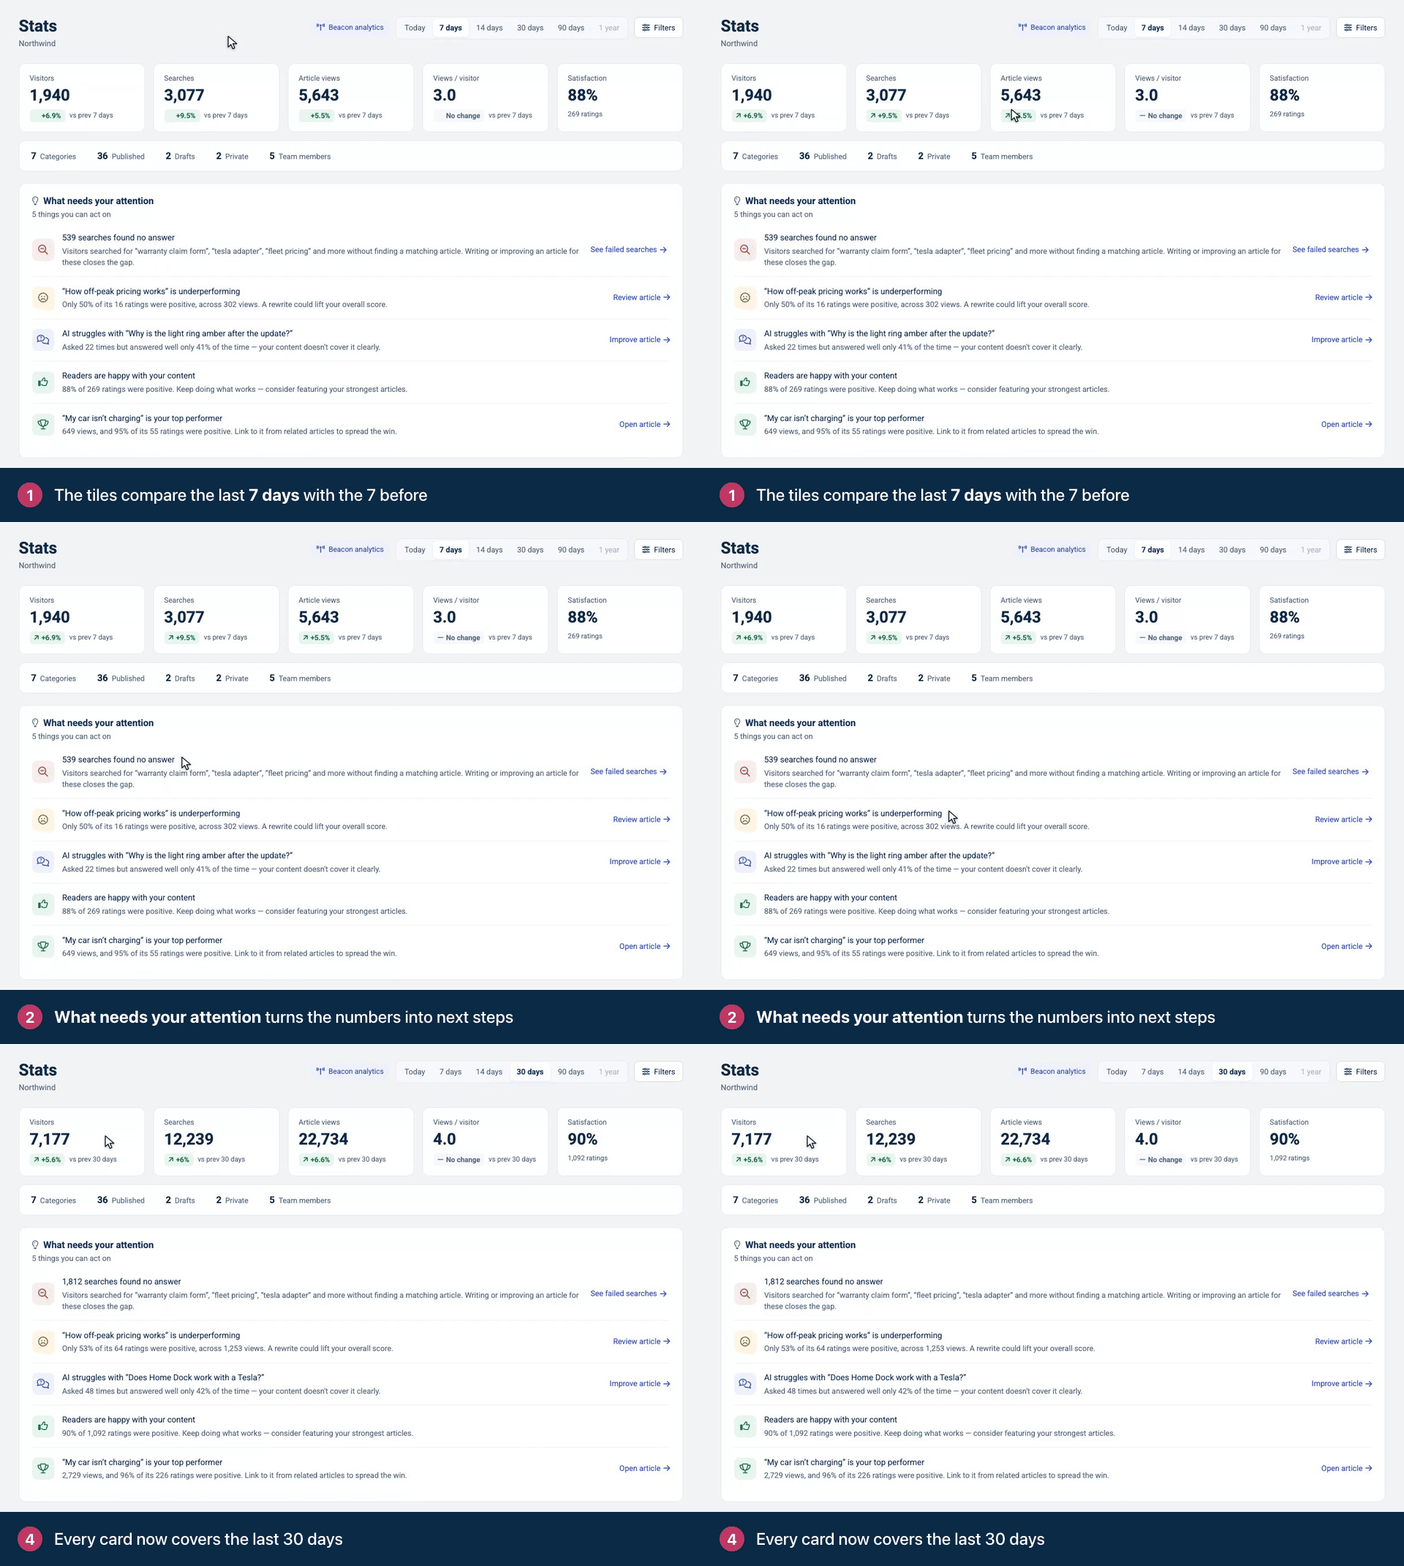
Pick a period at the top: Today, 7 days, 14 days, 30 days, 90 days or 1 year. Every card updates to match.
How far back you can look
How much history you can see depends on your plan. Periods longer than your plan's history are grayed out and show Not available on your current plan. See Plans and pricing.
The numbers at the top
Tile | What it counts |
|---|---|
Visitors | Unique browsers that visited your help center. |
Searches | Searches readers made. A search counts once, not once per letter typed. |
Article views | Times an article was opened. |
Views / visitor | How many articles a visitor opens, on average. |
Satisfaction | The share of article ratings that were positive, with the number of ratings it's based on. See Article ratings and reader feedback. |
The first four tiles also show the change compared with the period before, of the same length, for example "vs prev 7 days". The strip below the tiles shows all-time totals: Categories, Published, Drafts, Private and Team members.
How far back you can look depends on your plan. On Bootstrap the periods go up to 14 days, on Growth up to 30 days, and on Catalyst up to 1 year. Growth keeps 60 days of statistics: your longest range is 30 days, and the 30 days before it are what the tiles compare it with. See Plans and pricing.
The cards
What needs your attention turns the numbers into next steps: searches that found no answer, articles that are underperforming, questions AI struggles with, and your top performer. Most come with a button that takes you to the right place.
Traffic trends charts visitors, searches, article views and contact requests day by day.
Visitor journeys follows visitors from Visited to Searched, Read an article, Self-served or Contacted support. A visit counts as self-served when the visitor searched or read an article and didn't contact support. You also see the average steps before self-serving or contacting you, the share of visitors who searched first, the bounce rate (visitors who left after one page), and Recent sessions. Each recent session shows how it ended, when it started, its number of steps and how long it lasted. Click one to see its timeline step by step: what the visitor searched for, which articles they opened and how they rated them.
Content performance and Satisfaction show your most read and weakest articles. See Find your best and weakest articles.
What people search for lists searches, failed searches and content gaps. See See what people search for.
What people ask AI about your articles appears when AI Answers is on. It shows the questions readers ask about specific articles and how often they were answered well.
Filter the numbers
Click Filters, choose what you need and click Apply filters. Reset clears them.
Category narrows article views and the article cards to one category. Visitors and searches always cover your whole help center.
Language shows one language, if your help center has more than one.
Surface shows one place readers use: Full help center, Widget, Embedded help center or FAQ sections.
Include bots adds crawler and AI bot traffic, which is left out by default.
Exclude IP addresses leaves out visits from addresses you add, such as your office.
Traffic mode switches from Engagement events to Backend requests, which shows raw server traffic, bots included. In that mode, the insights, journeys, article and search cards are hidden. Backend requests may not count visits that reach your help center through a subfolder of your website; Engagement events does.
Bot family appears in Backend requests mode. Pick one crawler or AI bot to see only its requests, such as ChatGPT, Anthropic, Perplexity or Googlebot, or pick Other bots or Non-bot traffic. It shows which AI assistants and search engines read your help center.
How the numbers are counted
Real readers only. Statistics counts real browsers running JavaScript, so your totals can be lower than tools that count every server request.
Updated overnight. Visits and searches are processed once a night, so Today often looks empty. Today's traffic shows up tomorrow. Ratings show up right away.
Private articles stay private. If an article is private and hasn't been shared with you, you see Private article with a lock instead of its title. Its numbers still count.
Export your numbers
Statistics has no export button. To get the numbers into a spreadsheet or report, use the API. See Analytics on the developer portal.
Comments
Be the first to comment.